|
Munir
11/18/2016 04:32:26 am
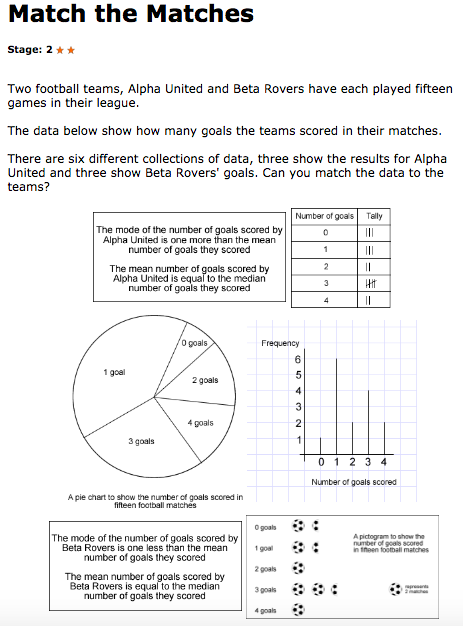
I first figured out which graphs were the same and which were different so I could work with less graphs. I first saw that the bottom right and top right were the same and that the line graph was different. I estimated in my head and figured out that the pie chart is the same as the line graph. Then I only used what for me are the similar out of the two pairs. I used the top right and the middle right. I figured out the mean(Both thirty divided by fifteen), two. The mode of one was three and the other was one. Now, knowing the first bit of the data we can prove that the top right and bottom right are Alpha United’s score and the middle two are the Beta Rovers score. Since both of the second bit of data was the same, I could not prove what I have just proved with that bit of data so I ignored it.
Munir
11/18/2016 04:33:35 am
Sorry, that first sentence should be what graphs were the SAME not different.
sury
11/18/2016 05:04:17 am
Alfa United - 30 gaols
Ms. Rehana
11/28/2016 04:13:07 am
Proud of you Munir and Surynash
dhruv
12/15/2016 07:12:51 am
alfa 30 Leave a Reply. |
AuthorWrite something about yourself. No need to be fancy, just an overview. Archives
February 2017
Categories |
 RSS Feed
